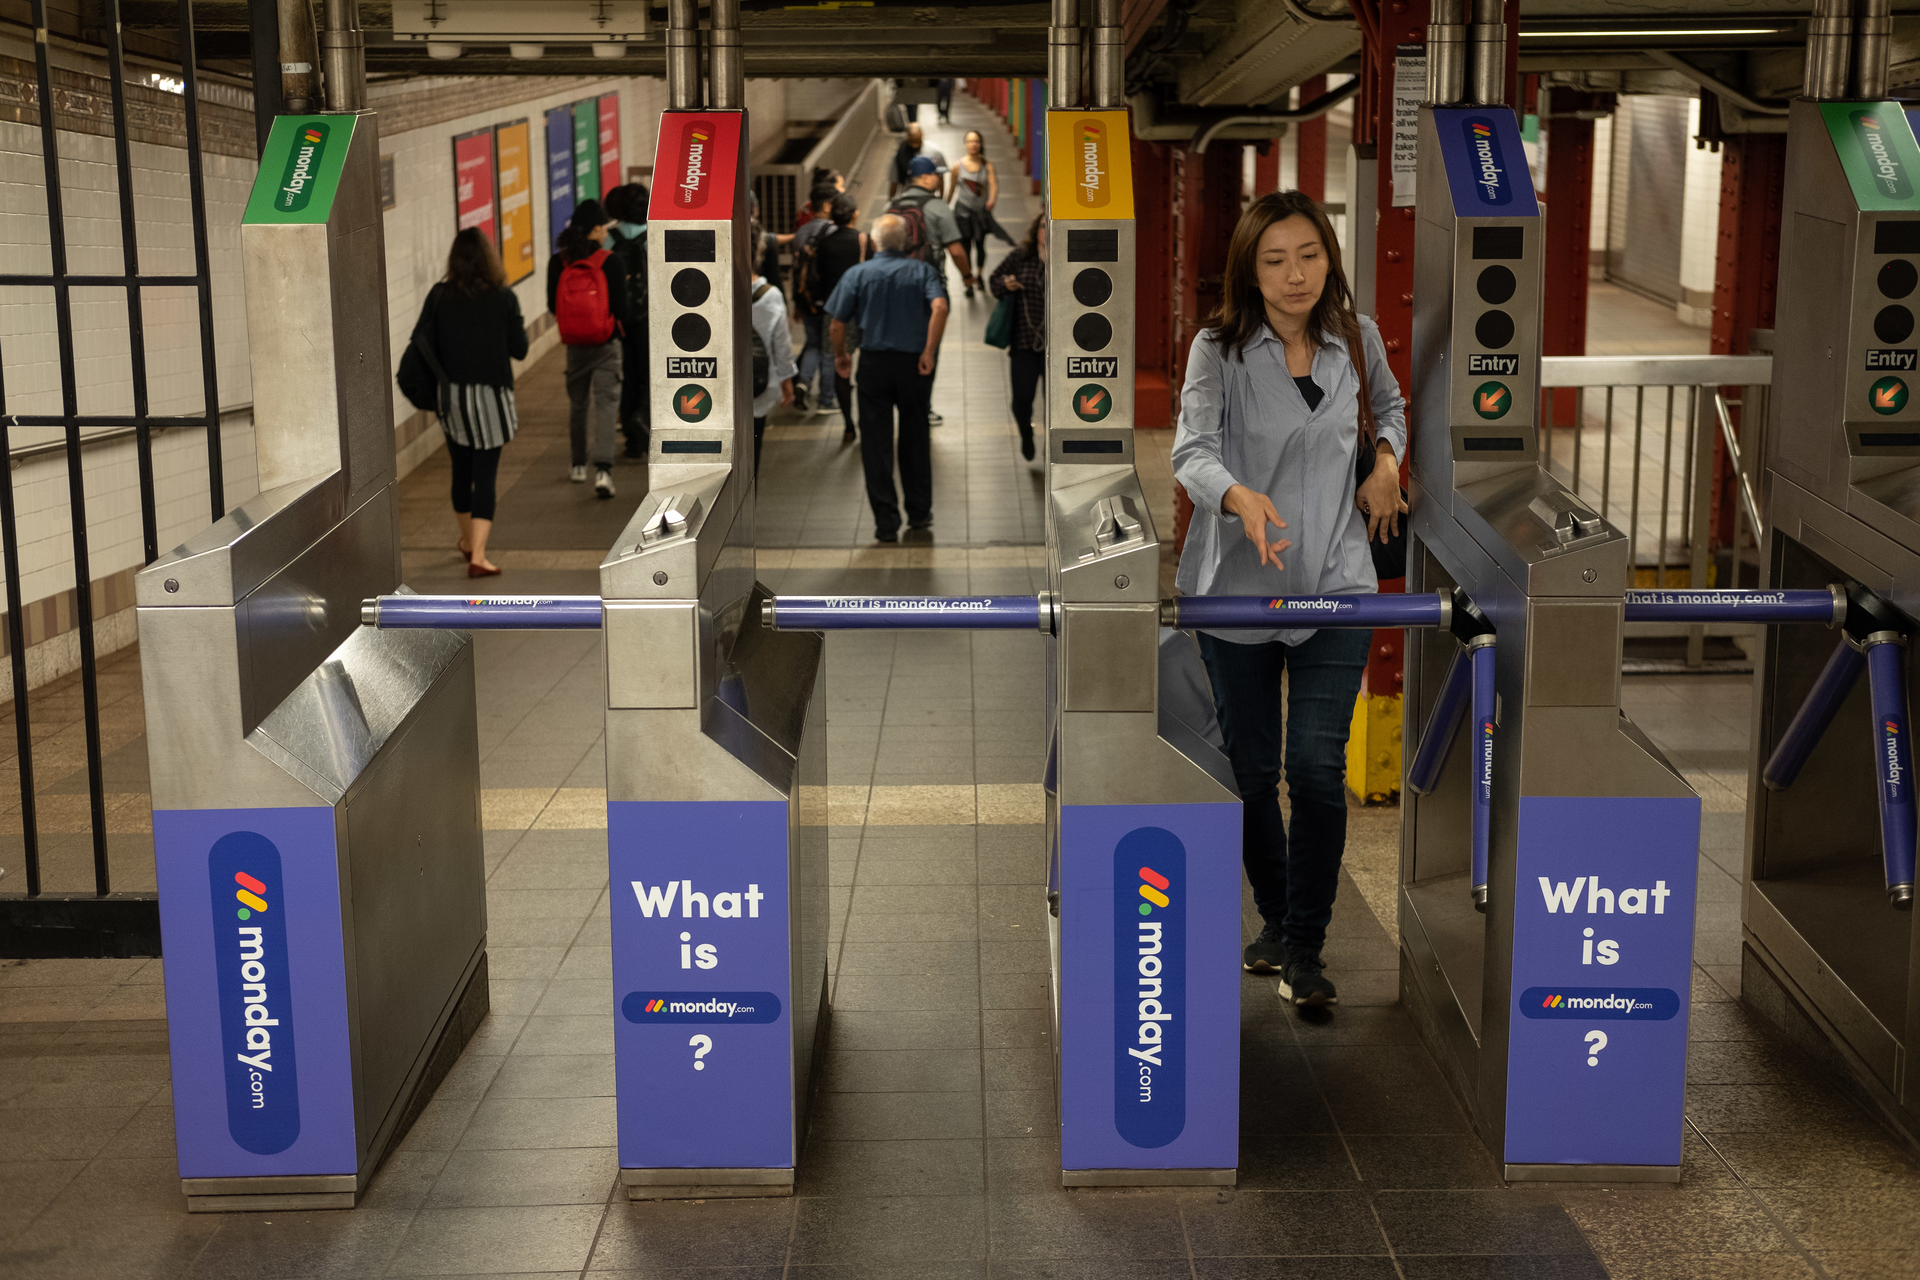
Leah Walters, Head of Communications at monday.com looks at how they went about advertising themselves.
While most out-of-home campaigns rely on qualitative formats of measurement, monday.com’s entire growth strategy is data-centric and with our recent foray into offline advertising, things should be no different.
Tel Aviv to NYC
At monday.com, we’re entirely data-obsessed, and through performance marketing campaigns, our main source of user acquisition, we can determine exactly how much it costs to acquire a customer and how efficient each acquisition is. As we scale, we decided to complement our performance efforts with a brand awareness campaign in the form of offline advertising.
We used a combination of a data science experiment, market research polling, extensive data analysis, and a little bit of faith.
For us, New York was an obvious place to begin our brand awareness efforts. We have a burgeoning new office in the city, our investors are located there, and it just so happens to be one of the global epicenters of culture and business. We immediately jumped right into the planning for this campaign from our Tel Aviv office (5,600 miles away), while applying the same data-driven principles that we do to our performance marketing campaigns. Here’s how we did it.
Step 1: Strategize
We first had to determine the exact locations of our advertisements. After doing extensive research, analyzing metrics including pedestrian traffic and where our target market was most concentrated, we decided on eight billboards sprinkled across the lower half of Manhattan and two station “takeovers” at Union Square and Bryant Park. At this time, our data science team jumped into action on studying the specific geo-locations to determine our user behavior trends before we launched in these specific areas so we could cross reference after to determine any lift in acquisition from the campaign.
Step 2: Create
Our product is the core of who we are as a company and our in-house design team has worked really hard to effectively express our values in a beautiful and engaging way throughout our team management platform. We wanted this same sentiment expressed to the NYC audience so our team embraced the massive undertaking of producing the entire campaign in-house. We thought the hardest part was over once we bought the media…boy were we wrong! When we sat down to determine our creative direction, we were overwhelmed with concepts. We decided to answer the quintessential question of “What is monday.com?”
Because our platform is used by teams of two to 2,000 across over 200 business verticals, the answer is different for different teams. We ultimately proceeded with a teaser campaign where the billboards asked only the question “what is monday.com?” and the subway station installations had 28 different answers, sourced from what our users share as their most popular use cases. Our brand identity has evolved as we’ve scaled, and when faced with the pressure of expressing everything in a single campaign, back to basics felt right for us. The ads were colorful, humorous, and reflective of our true brand identity.
There are approximately 180 pieces of media in each subway station and we left no surface untouched. Visualizing this was a huge challenge from Tel Aviv, so in true monday.com form, we built our own solution. We sourced an interactive 3D model of exactly what the subway station would look like so we could place each piece of media accordingly. Today, nearly every brand campaign includes components of integrated marketing. It’s critical for brands to use multiple platforms to complement one another, and in our case, we ran simultaneous digital campaigns on Facebook and YouTube that were geo-targeted to our specific offline areas of focus. The impact of having multiple touch points is invaluable. To gather integrated insight, we measured the impact of each channel through deep data and a complex attribution model.
Step 3: Assess Impact
It seems to be nearly impossible to quantify the ROI of an offline brand awareness campaign immediately. But this component was, and continues to be, absolutely essential to us. Once things were up and running, we further infused our data-driven methodologies to assess impact. Our BI team set parameters that allowed us to evaluate performance from the moment the campaign went live, filterable by specific geographic properties and demographic criteria to determine real-time impact. Such metrics included website visits and sign-ups (and ultimately conversions) that could each be attributed to a specific ad. Here are a few ways we measured effect:
- Brand awareness survey: We issued a brand awareness survey to two separate sets of 750 respondents that either live or work in NYC, before and after the campaign respectively, to determine any change in brand awareness.
- Heat map: The initial experiment run by our data scientists provided us with a detailed understanding of user behavior in New York before the campaign. As it went live, this allowed them to detect exactly where the lift came from and they created a live populated heat map which we displayed throughout our office.
- Signup data collection: As new signups came in from the New York area, we asked them specifically how they learned about us so we could determine exactly which properties were most effective. You can see how we asked below:
And this is just the beginning. In January 2019, we’ll launch the second phase of our New York campaign, branding over 570 subway cars and additional subway stations too. We then hope to replicate this in cities around the world. Stay tuned.


